Monitoring VMware with Icinga
November 29, 2018
One of my coworkers and I have been working on building a monitoring environment using Icinga, and I began to consider some options for monitoring the VMware environments that we support. PowerCLI is great for programmatically interacting with VMware environments, and PowerShell for Linux removes the barrier for integrating PowerShell and PowerCLI scripts in a Linux monitoring environment. My goal was to run our check scripts directly on one of our Icinga masters, without the need for a separate Windows satellite that would only be used for running scripts. This article explains that process in detail, and most of the content is broadly applicable to any PowerShell-based check script that you might want to run in an Icinga (or Nagios, or whatever) monitoring environment.
This article assumes familiarity with Icinga2, its web interface (IcingaWeb2 and Icinga Director), and VMware PowerCLI. However, you can still follow along if you’re using a different monitoring solution.
Putting together a check script
First, you’ll want to actually have some type of PowerCLI script that can:
- Provide Nagios compatible exit codes
- Optionally provide Nagios compatible performance data
I’ve written a basic check for vSphere memory and CPU utilization, and it’s available on Github.
My script allows for either host or cluster-level monitoring (cluster-level calculations are made by simply summing the values of performance counters for all of the hosts in the cluster). It can also alert based on percent (used and free) or raw GBs or GHz (used and free). It’s a work in progress, but it’s getting the job done for now. In the future, I’d like to improve the threshold handling so that it can actually handle ranges per the Nagios Plugins Development Guidelines.
At any rate, the example below, executed from PowerShell on Windows, throws a warning alert when 40% of memory is used, a critical alert when 60% of memory is used, and outputs performance data for percent used/free and raw GB used/free. As we can see, 63% is currently used so we get a critical alert.
PS C:\Users\tony> ./check_vsphere -Server vcenter.example.com -Mode Cluster -Cluster "Production" -Metric Memory -Critical 60 -Warning 40 -ThresholdType PercentUsed
CRITICAL: 63.121741627768801494217281440% Memory Used | 'Memory Used'=1453.8720703125GB;;;0;2303.282566070556640625 'Memory Free'=849.410495758056640625GB;;;0;2303.282566070556640625 'Memory Pct Used'=63.121741627768801494217281440%;40;60;0;100 'Memory Pct Free'=36.878258372231198505782718560%;;;0;100
Setting up PowerShell and PowerCLI
OK, so we have a script. Now we just have to get that script running on one of our Icinga hosts. For the sake of simplicity, we’ll get it running on our Icinga master. However, it could be in whatever zone you wanted.
One really cool thing about PowerShell is that it can run on Linux. That might make some traditionalists feel uncomfortable, and it probably makes even the best admin question its usefulness. However, monitoring is a great use case for running PowerShell on a Linux box. Running PoSH on our Icinga server opens up an entire world of Windows connectivity and monitoring, without using NSClient++ or needing some type of jump box into our Windows environment. For our VMware environment, we can even run PowerCLI.
First, we need to install PowerShell on Linux. Always consult the official docs, but this is pretty straightforward. For CentOS, that just involves grabbing the repo and doing a yum install:
curl https://packages.microsoft.com/config/rhel/7/prod.repo | sudo tee /etc/yum.repos.d/microsoft.repo

sudo yum install -y powershell

# Test to make sure that PoSH can run
pwsh
There’s also some configuration that we should do ahead of time so that PoSH and PowerCLI will run as intended. First, we may want to update the Powershell help files:
PS /home/tony>Update-Help
Next, we’ll install the PowerCLI modules. Since it’s available through the Powershell Gallery, this is easy:
PS /home/tony>Install-Module -Name VMware.PowerCLI
If we’re using a self-signed or otherwise invalid certificate for vCenter (we shouldn’t be, but let’s be real), then we need to change the default behavior when PowerCLI encounters an invalid certificate:
PS /home/tony>Set-PowerCLIConfiguration -InvalidCertificateAction Ignore -Scope AllUsers
Finally, to avoid any unnecessary output in our checks, we should indicate whether or not we want to participate in the PowerCLI Customer Experience Improvement Program (CEIP):
PS /home/tony>Set-PowerCLIConfiguration -Scope AllUsers -ParticipateInCeip $false
Creating a Service Account
Since our script will be run in an automated way, we need to create a service account for the script to use when connecting to vCenter. A simple Read Only account will do the trick:
-
Navigate to Administration > Users and Groups
-
Add a new user under the vsphere.local domain, as seen below

-
Navigate to Administration > Global Permissions
-
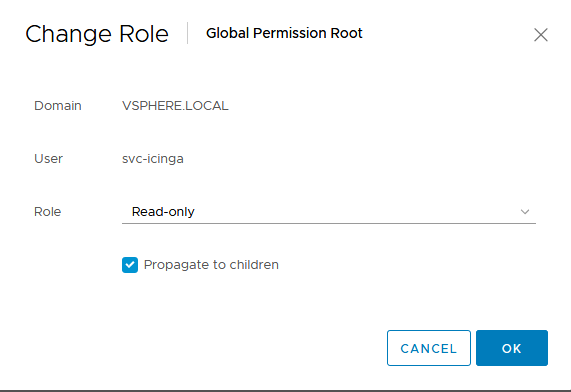
Grant the svc-icinga user the Read-only role, as seen below
Adding the command to Icinga
We now have everything in place to successfully run our script as an Icinga command. First, let’s download the repository to the default plugin directory for Icinga:
cd /lib64/nagios/plugins
git pull https://github.com/acritelli/check_scripts.git
Effectively, we just need to call /usr/bin/pwsh and feed it our script (/lib64/nagios/plugins/check_scripts/check_vsphere/check_vsphere.ps1) with the appropriate arguments, and we’ll have a fully functioning check command for Icinga.
If you use Icinga Director (I do), then you might be thinking: Great, I can just add a new command definition using Director and I’ll be all set. Unfortunately, it’s not that simple. Commands run using Icinga don’t have a HOME environment variable set, and this is, for some unknown reason, absolutely necessary for PowerCLI to work properly. If the HOME environment variable isn’t set, then the script will simply fail (and it won’t provide any useful debugging information about the cause of failure).
Icinga Director doesn’t currently provide a way to set command environment variables from the web interface], so we’ll have to use a config-file based command definition. I’ve written a definition and it’s included as part of the repo, so you can just copy this into your commands.conf, symlink it, or follow whatever environment best practice you have for adding new command definitions. In my case, I simply:
- Copied the command definition into
/etc/icinga2/conf.d/commands.conf - Ensured that the above file is included by
/etc/icinga2/icinga2.conf - Restarted the icinga2 service
We also need to add a cron job for the icinga user to periodically remove the temporary RecentServerList.xml file that is generated when running PowerCLI scripts. For some reason, this file frequently becomes corrupted when running multiple instances of PowerCLI scripts at the same time (as is the case if you’re monitoring more than a single vSphere host). This results in ugly cosmetic errors in the Icinga check output. To resolve this, we can just add a 5 minute cron job for the icinga user:
crontab -eu icinga

# Add the following line to the crontab
*/5 * * * * /usr/bin/rm /tmp/.local/share/VMware/PowerCLI/RecentServerList.xml
Monitoring some hosts
We now have (almost) enough configuration to begin monitoring hosts. At this point, we can create all of the necessary components using Icinga Director and begin to actually monitor our vSphere environment. For this example, I’m going to walk through creating the necessary templates and configuration for monitoring an entire cluster. The same steps generally apply to monitoring individual hosts.
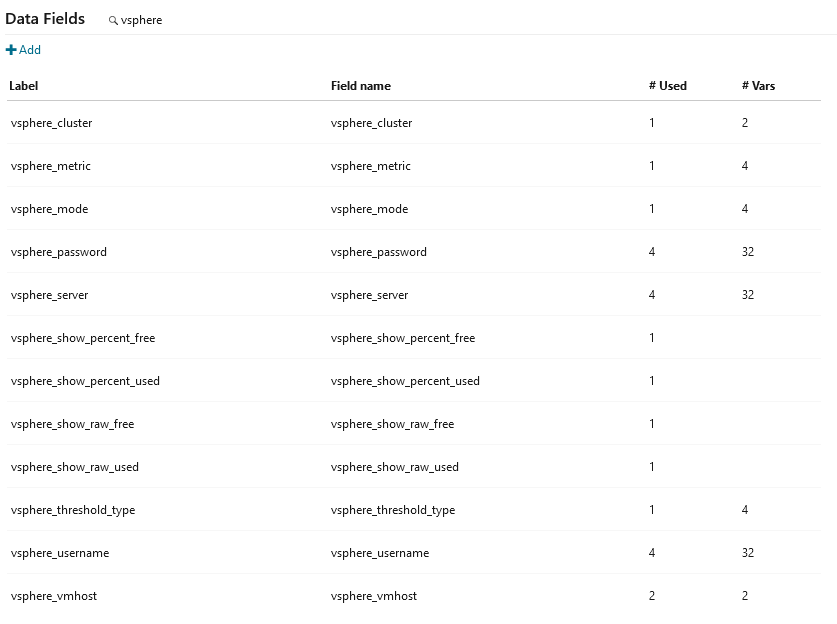
First, we need to define custom data fields for all of the fields defined in the check command (or, minimally, all of the fields that we expect to actually use in our service definitions). I won’t go through the entire process since I’m assuming familiarity with Director, but you’ll need to navigate to Icinga Director > Define Data Fields and add in all of the necessary fields to match the check command:
With the data fields defined, we can create a Service Template (Icinga Director really loves templates). The service template is going to vary based on your environment, but I import an existing “5 Minutes Checks” template that runs our checks…..every 5 minutes. I then provide the check_vsphere command, which we defined in our external command definition from above. I also give the template all of the custom data fields that we created so that individual service definitions can set these fields. To create a service template, you’ll want to go to Icinga Director > Services > Service Templates > Add and create something along the lines of the template below.
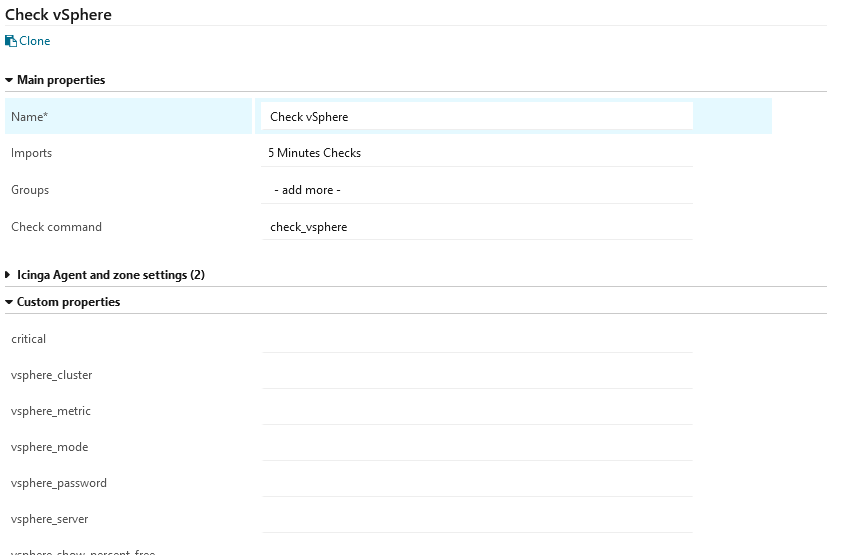
Important: If you don’t see a command for “check_vsphere,” then you may need to run the Director Kickstart Wizard to synchronize Icinga Director with the underlying Icinga 2 infrastructure. The Kickstart Wizard can be run from Icinga Director > Icinga Infrastructure > Kickstart Wizard and may take some time to complete before the external command definition is visible.
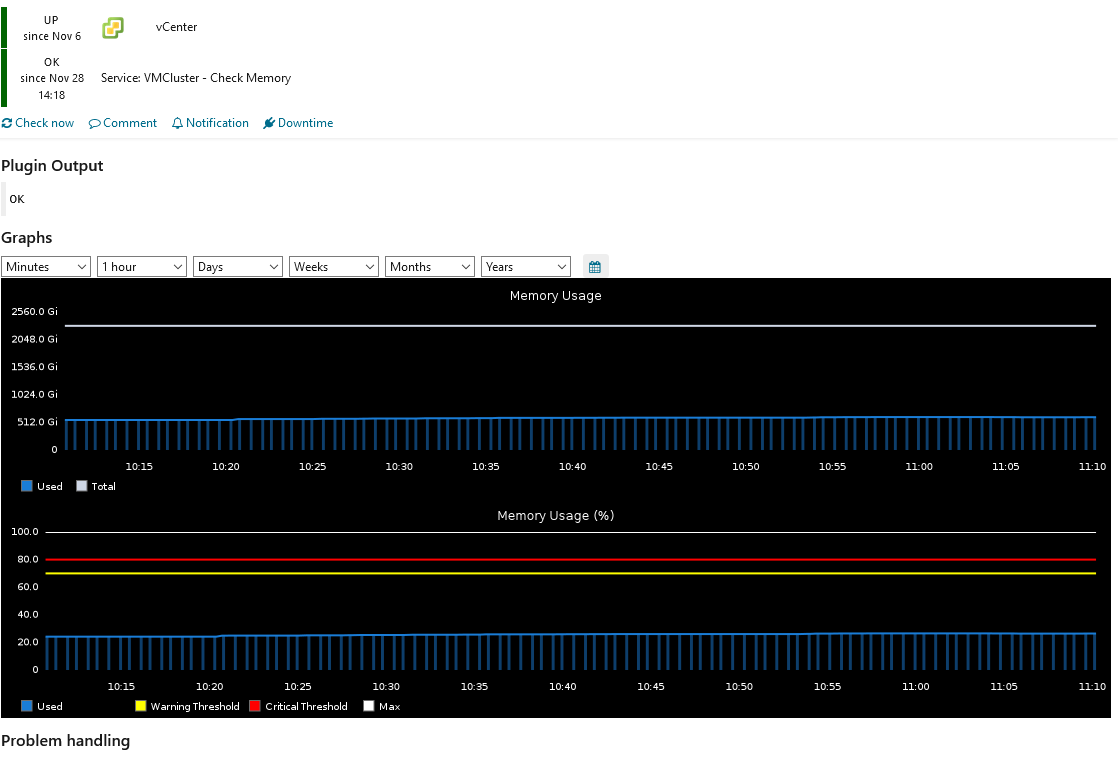
With a command template defined, we can add an individual service check through Icinga Director > Services > Single Services > Add. This assumes that you have already added a host for your vCenter environment, since the check will be applied to that host. Again, the specifics will vary based on your environment, but I’ve defined a check for memory utilization that will warn at 70% memory used and alert critical at 80% memory used:
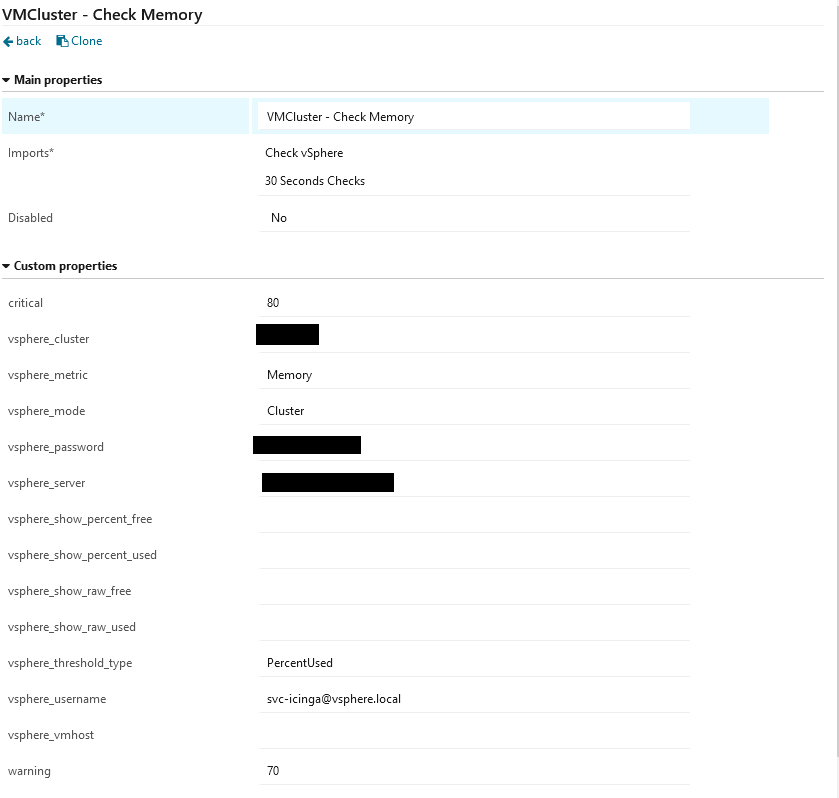
A note about security: As you can see, the service account credentials are clearly stored in the Icinga configuration. Ideally, we should store them as a secure string in a file, as described [here](<https://blogs.technet.microsoft.com/robcost/2008/05/01/powershell-tip-storing-and-using-password-credentials/). Unfortunately, secure strings in Powershell for Linux are currently broken.
That’s it!
With our configuration in place and our check successfully deployed, we can see some nice service check results in Icinga. I’m using the Icinga Graphite Module, so we get some nice graphs that you can see below. Overall, I’m impressed (and honestly, surprised) with just how well PowerShell on Linux and the PowerCLI modules “just work.” It opens up a world of possibilities for monitoring things in both Windows and VMware environments using their native tools, without the need for some kind of jump box or script host. Hopefully, this discussion helps out some people who are looking to start monitoring VMware in their environment using PowerCLI and Icinga.
Previous article: Connecting to systemd-nspawn SSH containers in Ansible
Next article: Using Vault as a CA for Graylog

